Vibe coding resource #5: code optimization workflow
Your AI assistant generated 2,000 lines of working code in an afternoon. The app runs, the demo looks great, and then you open the browser DevTools. Three-second page loads, memory climbing with every click, and a bundle size that would make a webpack config cry. The gap between working code and optimized code is where most vibe-coded projects stall out.

Your AI assistant generated 2,000 lines of working code in an afternoon. The app runs, the demo looks great, and then you open the browser DevTools. Three-second page loads, memory climbing with every click, and a bundle size that would make a webpack config cry. The gap between working code and optimized code is where most vibe-coded projects stall out. This guide gives you a repeatable, step-by-step workflow to close that gap without needing a computer science degree.
Photo by Robo Wunderkind from Pexels
TL;DR:- AI-generated code works fast but rarely runs fast. Optimization is a separate, deliberate step.
- Follow a five-phase loop: Profile, Identify, Prompt, Validate, Document.
- Use browser profilers, Lighthouse, and targeted AI prompts to fix the 20% of code causing 80% of slowdowns.
- Build the habit into every sprint, not as a one-time cleanup.
Why optimization breaks vibe-coded projects
Code that AI produces tends to be correct but naive. It solves the stated problem with the most straightforward approach: nested loops where a hash map would do, full re-renders where memoization would help, synchronous calls where async batching would cut latency in half. None of this shows up during development on localhost with a fast machine and a small dataset.
The trouble surfaces in production. Real users on 4G connections, databases with 100k rows instead of 10, and concurrent requests that expose every unoptimized query. If you shipped an AI-built app and watched performance degrade within weeks, you are not alone. The pattern is predictable, and so is the fix.
That 20% bar is not a guess. Profiling consistently shows that a small fraction of your codebase accounts for the vast majority of execution time. The optimization workflow below targets exactly that fraction.
Common optimization mistakes

Before jumping into the workflow, here are the traps that catch builders who try to optimize without a system:
- Optimizing by intuition. You rewrite the function that "looks slow" instead of measuring. Half the time, the bottleneck is somewhere else entirely.
- Asking AI to "make it faster" without context. A vague prompt produces vague results. The AI might refactor code that was already fine and ignore the actual hot path.
- Premature micro-optimization. Shaving nanoseconds off a utility function while a 400ms database query runs on every page load.
- Skipping validation. You accept the AI's "optimized" version without benchmarking it against the original. Sometimes the rewrite introduces bugs or is actually slower.
- One-and-done thinking. Optimization is not a single event. New features add new code, and performance regresses unless you build checks into your workflow.
The five-phase optimization loop

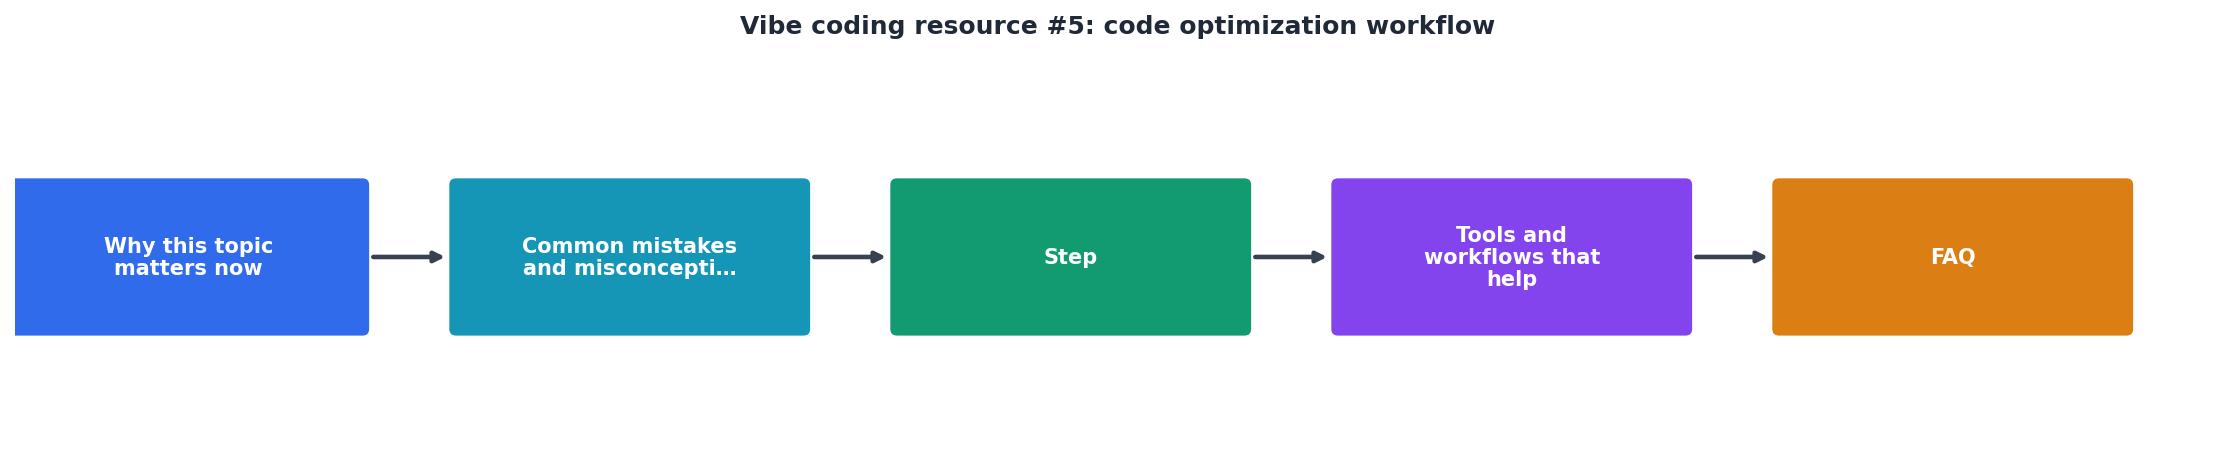
This workflow is a loop, not a line. You run it every time you ship a meaningful feature or notice a performance change. Each phase feeds the next.
Phase 1: Profile
Open your profiling tools and collect real data. For frontend work, Chrome DevTools Performance tab and Lighthouse give you load times, layout shifts, and JavaScript execution breakdowns. For backend, use your framework's built-in profiler or a tool like py-spy (Python), clinic.js (Node), or database EXPLAIN ANALYZE for SQL queries.
Record specific numbers: page load in milliseconds, largest contentful paint, API response times under load, memory usage over a session. Write them down. These are your baseline.
Phase 2: Identify
Sort the profiling results by impact. Look for:
- Functions or components consuming the most CPU time
- Queries running without indexes or fetching unnecessary columns
- Render cycles triggered too frequently
- Assets (images, scripts, fonts) blocking the critical path
- Memory allocations that grow without cleanup
Phase 3: Prompt
This is where AI becomes your optimization partner. Instead of a generic "optimize this code," craft a specific prompt that includes:
- The exact function or query
- The profiling data (e.g., "this function takes 340ms on a list of 5,000 items")
- The constraint (e.g., "must stay under 50ms," "cannot change the public API")
- The context (e.g., "this runs on every page navigation in a React SPA")
"Can you review for breadth and clarity and think of a few ways it could be improved, if necessary.">, A Structured Workflow for "Vibe Coding" Full
A prompt like "This SQL query takes 1.2 seconds on a table with 200k rows. It joins three tables and filters by date range. Suggest index additions and query restructuring to get it under 200ms" will produce dramatically better results than "make my database faster."
Phase 4: Validate
Run the optimized code through the same profiling setup. Compare the new numbers against your baseline. Check three things:
- Speed: Did the target metric actually improve?
- Correctness: Do all existing tests pass? Run your test suite.
- Regression: Did anything else get slower? Check adjacent metrics.
Phase 5: Document
Write a short note (even a code comment or commit message) recording what you changed, why, and the before/after numbers. This serves two purposes: it prevents you from re-investigating the same bottleneck later, and it teaches your AI assistant context for future prompts.
Tools and workflows that help

Here is a practical breakdown of tools mapped to each phase of the workflow. You do not need all of them. Pick one per category and learn it well.
| Phase | Frontend Tools | Backend Tools |
|---|---|---|
| Profile | Chrome DevTools, Lighthouse, WebPageTest | py-spy, clinic.js, EXPLAIN ANALYZE |
| Identify | React DevTools Profiler, bundle analyzers | APM dashboards (Sentry, Datadog) |
| Prompt | Cursor, Claude, GitHub Copilot Chat | Same AI tools with backend context |
| Validate | Lighthouse CI, Playwright benchmarks | k6, Artillery, pgbench |
| Document | Git commit messages, ADR files | Same |
Cursor and Claude stand out for optimization prompts because they can hold large file contexts. Paste the profiling output directly into the conversation. Lighthouse CI integrates into your deployment pipeline so performance regressions get caught before they reach users.
For database-heavy apps, EXPLAIN ANALYZE is non-negotiable. Run it on every query that touches more than a few hundred rows. AI assistants are surprisingly good at reading query plans and suggesting index strategies when you give them the full output.
The dashboard below shows what a typical optimization session looks like in practice. These numbers represent a real-world scenario: a vibe-coded e-commerce product page before and after running through the five-phase loop.
Optimization Session Results
E-commerce product page, before vs. after one loop
Building the habit
Optimization is not a weekend project. It is a recurring step in your development cycle. The most effective approach: run the Profile and Identify phases after every feature branch merge. Keep a running document of your top bottlenecks and their current metrics. When a metric crosses a threshold you set (say, API response time exceeds 500ms), trigger a full optimization loop.
If you use CI/CD, add a Lighthouse CI check or a simple load test that fails the build when performance drops below your baseline. This turns optimization from a manual discipline into an automated guardrail.
The Vibe Coding Bible at vibecodingbible.org covers this workflow in depth across multiple chapters, including prompt templates for each phase and real project case studies showing the before/after of systematic optimization.
Code Optimization Workflow Checklist
Your progress is saved automatically in your browser.
FAQ
Frequently Asked Questions
Additional Resources
- A Structured Workflow for "Vibe Coding" Full-Stack Apps - Although you can do a lot without ever touching code yourself, it still requires you, the developer, to guide, review, and understand the code.
- Taming Vibe Coding: The Engineer's Guide - The vibe coding workflow · Red (Fail): You start with a small feature or test that fails. · Green (Pass): Focus solely on making that test pass.
- Complete Beginner's Guide to Vibe Coding an App in 5 ... - How I built a full-featured podcast analytics dashboard with GitHub Copilot without writing a single line of code myself.
Ready to Master Vibe Coding?
Learn to build software faster with AI assistance using the Vibe Coding Bible.
Get Started