Optimizing AI Code for Speed: Techniques and Best Practices
AI tools like Cursor, Claude, and Copilot generate working code in seconds, but that code often runs ten times slower than it needs to. The gap between code that works and code that performs well is where most AI-built projects stall, crash under load, or rack up cloud bills that eat your margins. This guide walks through concrete optimization techniques you can apply today to make AI-generated code genuinely fast.


AI tools like Cursor, Claude, and Copilot generate working code in seconds, but that code often runs ten times slower than it needs to. The gap between code that works and code that performs well is where most AI-built projects stall, crash under load, or rack up cloud bills that eat your margins. This guide walks through concrete optimization techniques you can apply today to make AI-generated code genuinely fast.
TL;DR:- AI-generated code prioritizes correctness over performance. You need to profile first, then optimize algorithms, data handling, and hardware usage.
- Algorithm refinement (swapping O(n²) for O(n log n)), batched data operations, and GPU acceleration are the three highest-impact levers.
- A structured optimization checklist prevents you from guessing and keeps improvements measurable.
Why speed optimization matters
Speed is not a luxury feature. A REST endpoint that takes 3 seconds instead of 200 milliseconds means users leave, conversions drop, and infrastructure costs multiply. When AI generates your code, it picks the most common pattern from its training data. That pattern is almost never the fastest one.
Consider a real scenario: you ask an AI to build a product search endpoint. It generates a loop that filters results in Python, iterating through every item in memory. It works with 100 products. With 50,000 products, the page takes 4 seconds to load. The fix is a database query with proper indexing, not a Python loop. AI did not know your dataset size, so it picked the simplest approach.
The pattern repeats across every layer of your stack. AI writes nested loops where hash maps work. It loads entire datasets into memory when streaming would suffice. It serializes data with the default JSON encoder when MessagePack cuts payload size by 60%. None of these are bugs. They are performance gaps that only show up under real conditions.
Techniques that improve speed

Before changing a single line, you need to know where the bottleneck actually is. Guessing wastes time and often makes things worse. Here is the sequence that works:
- Profile the code with a real workload. Use
cProfilefor Python, Chrome DevTools for frontend, orEXPLAIN ANALYZEfor SQL queries. - Identify the top three slowest operations. Usually one function or query accounts for 70%+ of total execution time.
- Apply the right optimization technique for each bottleneck (algorithm, data, or hardware).
- Measure again. If the improvement is less than 10%, move to the next bottleneck.
The following dashboard shows a typical optimization scenario for an AI-generated data processing pipeline. These numbers represent what you might see when processing 100,000 records through a standard ETL workflow:
Optimization Results: 100K Record ETL Pipeline
Refine algorithms first

Algorithm choice is the single biggest performance lever. No amount of hardware can fix an O(n²) algorithm processing a million records. AI tools frequently generate brute-force solutions because they optimize for readability and correctness, not computational complexity.
Common AI-generated patterns and their fixes
- Nested loops for lookups: AI writes a loop inside a loop to match items between two lists. Replace with a dictionary (hash map) lookup. Goes from O(n²) to O(n).
- Repeated sorting: AI sorts a list inside a loop that runs hundreds of times. Sort once, then use binary search with
bisectin Python. - String concatenation in loops: AI builds strings with
+=in a loop. Each concatenation creates a new string object. Use"".join(parts)orio.StringIOinstead. - Full collection copies: AI calls
list()or.copy()on large collections when a generator or iterator would avoid the memory allocation entirely.
duplicates = []
for i in range(len(users)):
    for j in range(i + 1, len(users)):
        if users[i].email == users[j].email:
            duplicates.append(users[i].email)
With 10,000 users, that is roughly 50 million comparisons. The fix:
from collections import Counter
email_counts = Counter(u.email for u in users)
duplicates = [email for email, count in email_counts.items() if count > 1]
One pass. 10,000 operations instead of 50 million.
"With AI agents, more and more work is done in natural langauge, instead of coding language.">, 4 Techniques to Optimize AI Coding Efficiency
This shift toward natural language prompting means you can describe the performance requirement directly: "Find duplicate emails in O(n) time using a hash-based approach." The AI will generate the optimized version from the start.
Hardware acceleration

When algorithm improvements hit their ceiling, hardware acceleration picks up the slack. This does not mean buying expensive GPUs for every project. It means knowing when to use the right tool.
GPU acceleration works best for:- Matrix operations (NumPy/PyTorch on CUDA)
- Image and video processing
- Batch inference with ML models
- Large-scale data transformations
- Use NumPy vectorized operations instead of Python loops. A vectorized multiply on a million-element array runs 50-100x faster than a for loop.
- Switch to Polars instead of Pandas for dataframe operations. Polars uses Rust under the hood and processes data in parallel by default.
- Use uvloop as your asyncio event loop for I/O-bound Python services. Drop-in replacement, 2-4x throughput improvement.
| Python Loop | Vectorized (NumPy) |
|---|---|
| 1M multiplications: ~820ms | 1M multiplications: ~4ms |
| Single CPU core | SIMD instructions |
| Easy to read | Slightly different syntax |
| Scales linearly | Scales with hardware |
For AI-built web applications, the most common hardware-related win is not GPU at all. It is connection pooling for database access. AI-generated code often opens a new database connection per request. A connection pool (like PgBouncer for PostgreSQL or the built-in pool in SQLAlchemy) reuses connections and cuts latency by 60-80% under load.
Handle data efficiently
Data movement is where most AI-generated applications waste time. The code works, but it loads too much, transforms too often, and writes too slowly.
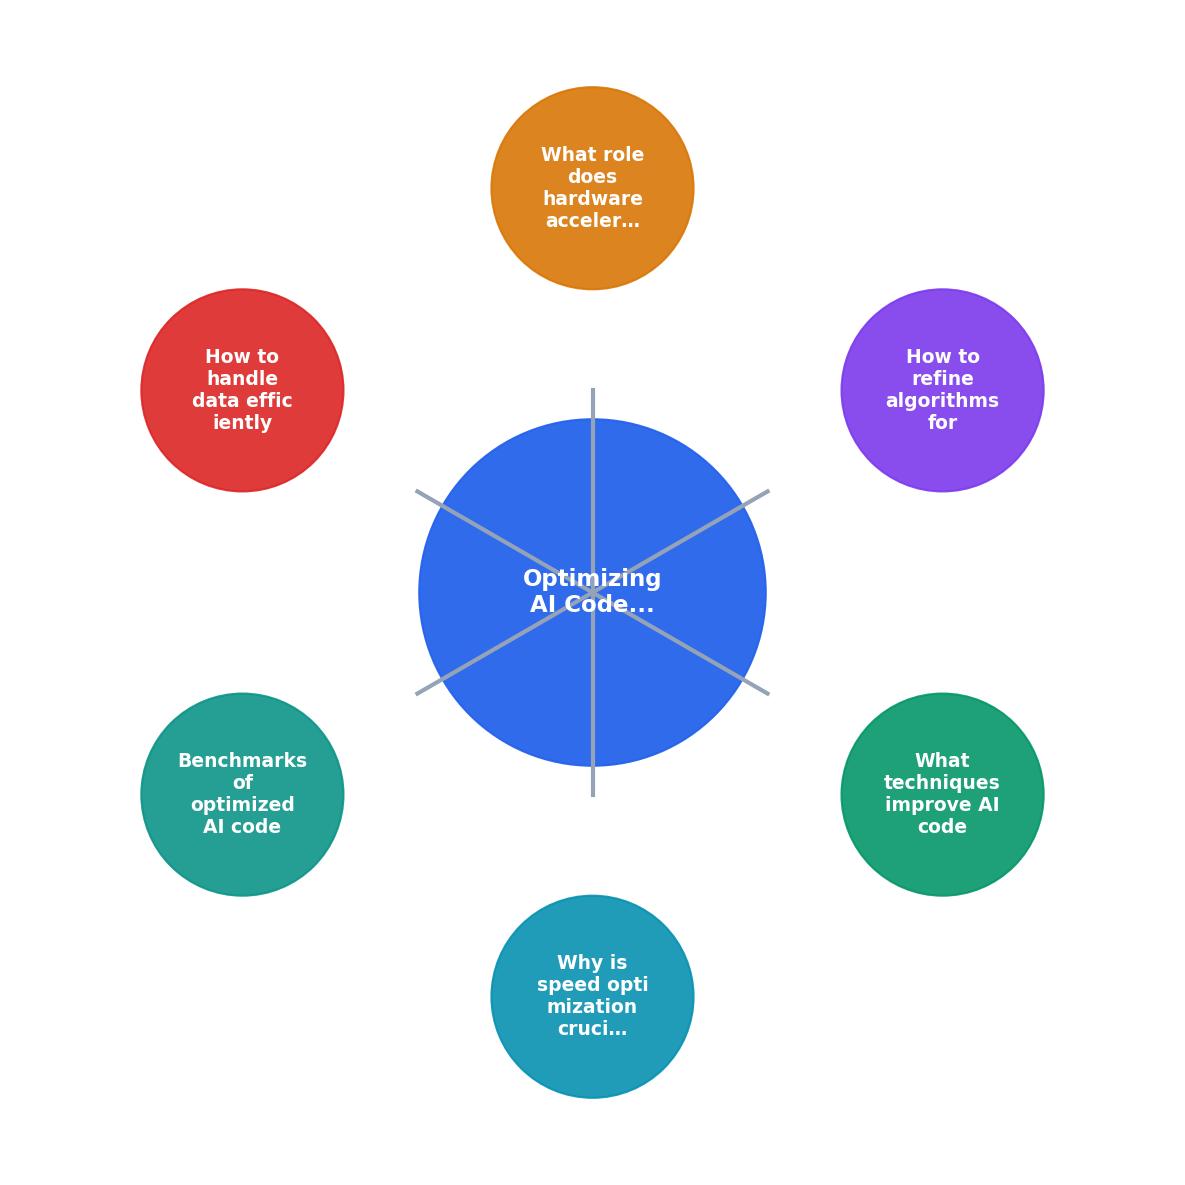
The process follows a clear path: Profile, Identify Bottleneck, Choose Technique, Apply Fix, Measure Result, and Repeat. Each cycle targets the current worst offender.
Five data handling rules
- Batch database writes. Instead of inserting rows one at a time (AI's default), use
executemany()or bulk insert. Writing 10,000 rows in one batch is 20-50x faster than 10,000 individual inserts. - Stream large files. AI loads entire CSV files into memory with
pd.read_csv(). Usepd.read_csv(chunksize=10000)or switch to Polars' lazy evaluation to process chunks. - Cache repeated queries. If the same database query runs multiple times per request, cache the result. Redis adds a dependency but cuts response times from 200ms to 2ms for cached data.
- Select only needed columns. AI writes
SELECTby default. Specify columns explicitly. On a table with 40 columns, selecting 5 reduces data transfer by 80%. - Compress API payloads. Enable gzip compression on your API responses. For JSON-heavy endpoints, this typically reduces payload size by 70-80%.
Tools and libraries worth using
You do not need to build optimization infrastructure from scratch. These tools handle the heavy lifting:
py-spyfor Python profiling without modifying code. Attaches to a running process and generates flame graphs.- Polars as a Pandas replacement for dataframe-heavy workloads. Parallel execution, lazy evaluation, and Rust-level speed.
- Cython / mypyc to compile hot Python functions to C. Typical speedup: 10-100x for numerical code.
locustfor load testing. Simulates hundreds of concurrent users so you find bottlenecks before your users do.pgcliwithEXPLAIN ANALYZEfor SQL query optimization. Shows exactly where your database spends time.- ONNX Runtime for ML model inference. Converts models from PyTorch/TensorFlow to an optimized format that runs 2-5x faster.
AI Code Speed Optimization Checklist
Your progress is saved automatically in your browser.
FAQ
Frequently Asked Questions
py-spy generates flame graphs from running Python processes without code changes. Polars replaces Pandas with parallel, Rust-backed dataframe operations. locust simulates concurrent users for load testing. ONNX Runtime optimizes ML model inference across frameworks. For database work, EXPLAIN ANALYZE in PostgreSQL shows exactly where queries spend time and which indexes are missing.Additional Resources
- 4 Techniques to Optimize AI Coding Efficiency - I'll cover four techniques I use daily when programming. I'll discuss how to be faster with prompting using Macwhisper for transcription. Then I ...
- How I Use AI to code with Speed and Accuracy - Always validate AI output — it's a collaborator, not a replacement · Be specific in prompts — include your tech stack and constraints · Maintain ...
- AI Code Optimization in 2026: Tools, Tactics, and How to Roll ... - AI tools meaningfully optimize code along three axes — performance, readability, and AI-specific concerns like token efficiency.
Ready to Master Vibe Coding?
Learn to build software faster with AI assistance using the Vibe Coding Bible.
Get Started