Best Practices for Using AI in Data Analytics
Every analytics team has that moment where someone plugs raw CSV data into a shiny new ML model and declares the results groundbreaking. Two weeks later, the dashboard numbers contradict reality, stakeholders lose trust, and the whole initiative stalls. The gap between running an AI model and producing reliable, actionable insights is filled by disciplined practices that most tutorials skip entirely. This article covers the specific preprocessing, model selection, and validation steps that separate useful AI analytics from expensive noise.

Every analytics team has that moment where someone plugs raw CSV data into a shiny new ML model and declares the results groundbreaking. Two weeks later, the dashboard numbers contradict reality, stakeholders lose trust, and the whole initiative stalls. The gap between running an AI model and producing reliable, actionable insights is filled by disciplined practices that most tutorials skip entirely. This article covers the specific preprocessing, model selection, and validation steps that separate useful AI analytics from expensive noise.
Photo by Kampus Production from Pexels
TL;DR:- Clean, well-structured data is the single biggest factor in AI analytics accuracy.
- Model selection depends on your data shape, volume, and the question you need answered, not on what is trending on Hacker News.
- Every AI-generated insight requires validation through holdout sets, domain expert review, and production monitoring.
- Following a repeatable workflow (preprocess, model, validate, monitor) turns one-off experiments into reliable analytics pipelines.
Why AI Changes Analytics
Traditional analytics relies on predefined queries and dashboards. You write SQL, build a chart, and interpret it yourself. AI flips that: models detect patterns across thousands of features simultaneously, surface anomalies you did not think to look for, and generate predictions that update as new data arrives.
"A Nucleus Research study found productivity improved 43% with AI as part of everyday analysis work.">, How to Use AI for Data Analysis
The practical advantages break down into three categories:
- Speed - Clustering millions of customer records takes minutes, not weeks of manual segmentation.
- Scale - AI handles high-dimensional data (hundreds of columns) where human intuition fails.
- Continuous learning - Models retrain on fresh data, keeping insights current without manual re-analysis.

Data Preprocessing Done Right
Data preprocessing is the work you do before any model touches your data: cleaning, transforming, and structuring it so the model receives consistent, meaningful input. Skip this step and your model learns from noise.
Handle Missing Values Explicitly
Do not let your framework silently drop rows or fill zeros. Decide per column:
- Numerical columns: median imputation works for skewed distributions; mean imputation for roughly normal ones.
- Categorical columns: a dedicated "Unknown" category preserves the signal that data was missing.
- Time-series gaps: forward-fill or interpolation, depending on whether the metric is cumulative or instantaneous.
Normalize and Encode Consistently
- Apply StandardScaler or MinMaxScaler to numerical features before feeding them to distance-based models (k-means, KNN, SVM).
- Use one-hot encoding for low-cardinality categoricals (under 15 unique values) and target encoding for high-cardinality ones.
- Store the fitted scaler/encoder objects alongside your model artifacts. Applying a different transformation at inference time is a common source of silent errors.
Remove Leakage Before Splitting
Data leakage occurs when information from the target variable bleeds into training features. Classic example: including "total_revenue" as a feature when predicting "will_churn." The model scores perfectly in testing and fails completely in production. Audit every feature for temporal or logical leakage before you split into train/test sets.
Selecting the Right AI Model
Model selection is not about picking the most complex algorithm. It is about matching the model to your data characteristics and business question.
Match Model to Data Shape
| Data Scenario | Good Starting Model | Why |
|---|---|---|
| Tabular, < 100K rows | XGBoost, LightGBM | Gradient boosting dominates structured data benchmarks |
| Tabular, > 1M rows | LightGBM, CatBoost | Handles scale with categorical support built in |
| Time-series forecasting | Prophet, ARIMA, temporal fusion transformers | Captures seasonality and trend components |
| Text classification | Fine-tuned BERT, or GPT-based embeddings + logistic regression | Contextual embeddings outperform bag-of-words |
| Anomaly detection | Isolation Forest, autoencoders | Designed for imbalanced, unlabeled scenarios |
Start Simple, Add Complexity
A logistic regression or decision tree baseline takes 30 minutes to build. It gives you a performance floor. If XGBoost only beats it by 1%, the simpler model is easier to explain to stakeholders and cheaper to maintain. Complexity should earn its place through measurable improvement.
Evaluate with the Right Metric
- Classification: accuracy is misleading on imbalanced data. Use precision, recall, F1, or AUC-ROC depending on whether false positives or false negatives cost more.
- Regression: RMSE penalizes large errors; MAE treats all errors equally. Pick based on business impact.
- Ranking/recommendation: use NDCG or MAP, not raw accuracy.
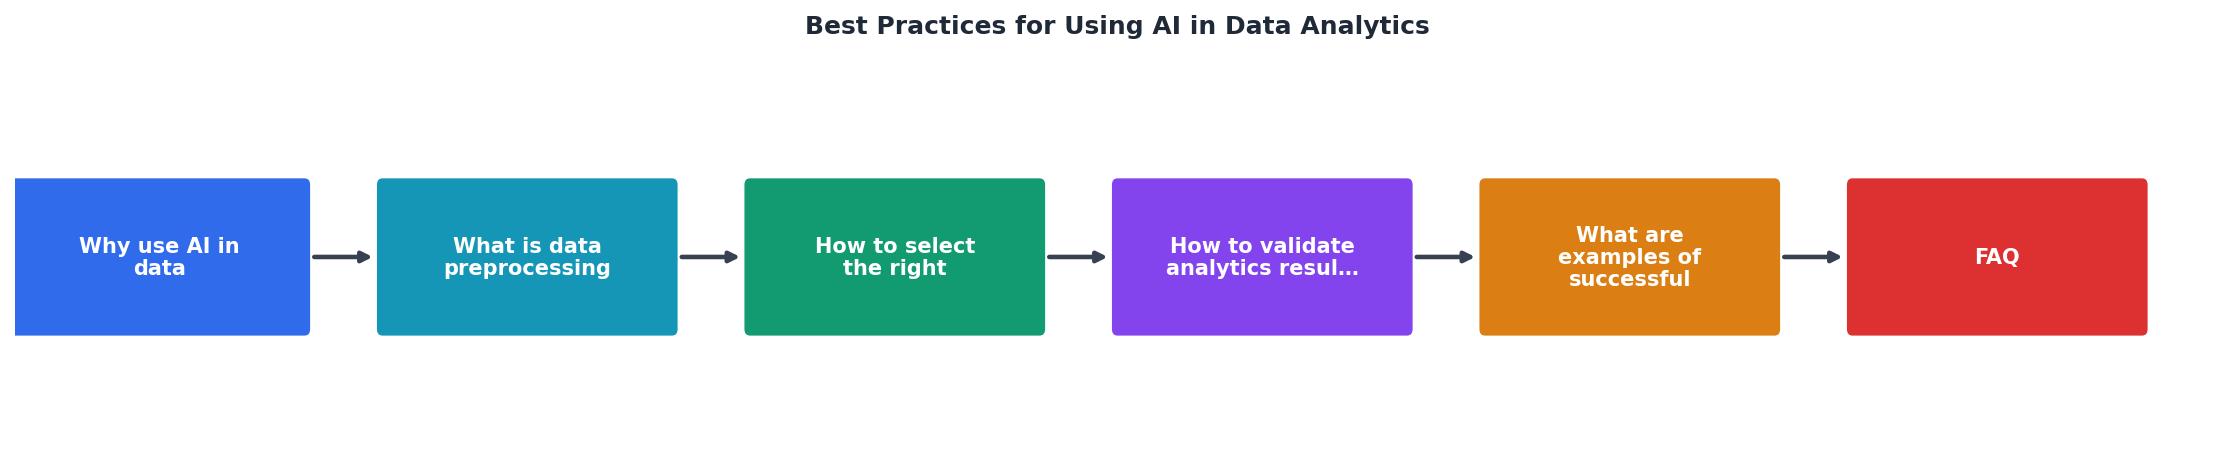
Model Selection Snapshot
Validating Analytics Results

A model that scores well on a test set can still produce misleading analytics. Validation is a multi-layer process.
Holdout and Cross-Validation
Split data into train, validation, and test sets. For time-series, use time-based splits (train on January-September, validate on October, test on November-December). Never shuffle time-series data randomly; it creates future leakage.
Use k-fold cross-validation (k=5 or k=10) on non-temporal data to get stable performance estimates. A single train/test split can be lucky or unlucky.
Domain Expert Review
Numbers alone do not catch nonsense. Show your top predictions or clusters to someone who knows the business domain. If the model says "customers who buy diapers are most likely to churn from a B2B SaaS product," something is wrong regardless of what the AUC says.
Production Monitoring
Deploy a monitoring layer that tracks:
- Input drift: are incoming feature distributions shifting from training data?
- Prediction drift: is the model's output distribution changing over time?
- Performance decay: are ground-truth labels (when available) showing declining accuracy?
Real-World Analytics Projects

Retail Demand Forecasting
Fraud Detection in Financial Services
Banks deploy ensemble models (random forests + neural networks) on transaction streams. Feature engineering extracts velocity metrics (transactions per hour), geolocation anomalies, and merchant category patterns. Validation requires stratified sampling because fraud events represent less than 0.1% of transactions. Production monitoring watches for adversarial drift as fraudsters adapt tactics.
Healthcare Readmission Prediction
Hospital systems use logistic regression and XGBoost on electronic health records to predict 30-day readmission risk. Preprocessing handles ICD code hierarchies, medication interactions, and missing lab values. Domain expert review catches clinically implausible risk factors. These models help allocate follow-up resources to high-risk patients.
AI Data Analytics Best Practices Checklist
Your progress is saved automatically in your browser.
FAQ
Frequently Asked Questions
What is the biggest data quality challenge you have faced when building an AI analytics pipeline? Share your experience so others can learn from it.
Additional Resources
- How to Use AI for Data Analysis - Intuit Blog - Practical Ways to Use AI for Data Analysis · Write or refine analysis code: · Speed up exploratory work: · Automate recurring reports: · Support ...
- AI for Data Analytics - Learn how to write SQL, build predictive and forecasting models, run sentiment analysis, and visualize data with AI data analytics.
- AI Data Analytics: Enhance Your Data Analysis - Embrace predictive and prescriptive analytics: Create predictive models in Excel to forecast trends and guide decisions about sales, market strategies, and ...
Ready to Master Vibe Coding?
Learn to build software faster with AI assistance using the Vibe Coding Bible.
Get Started